
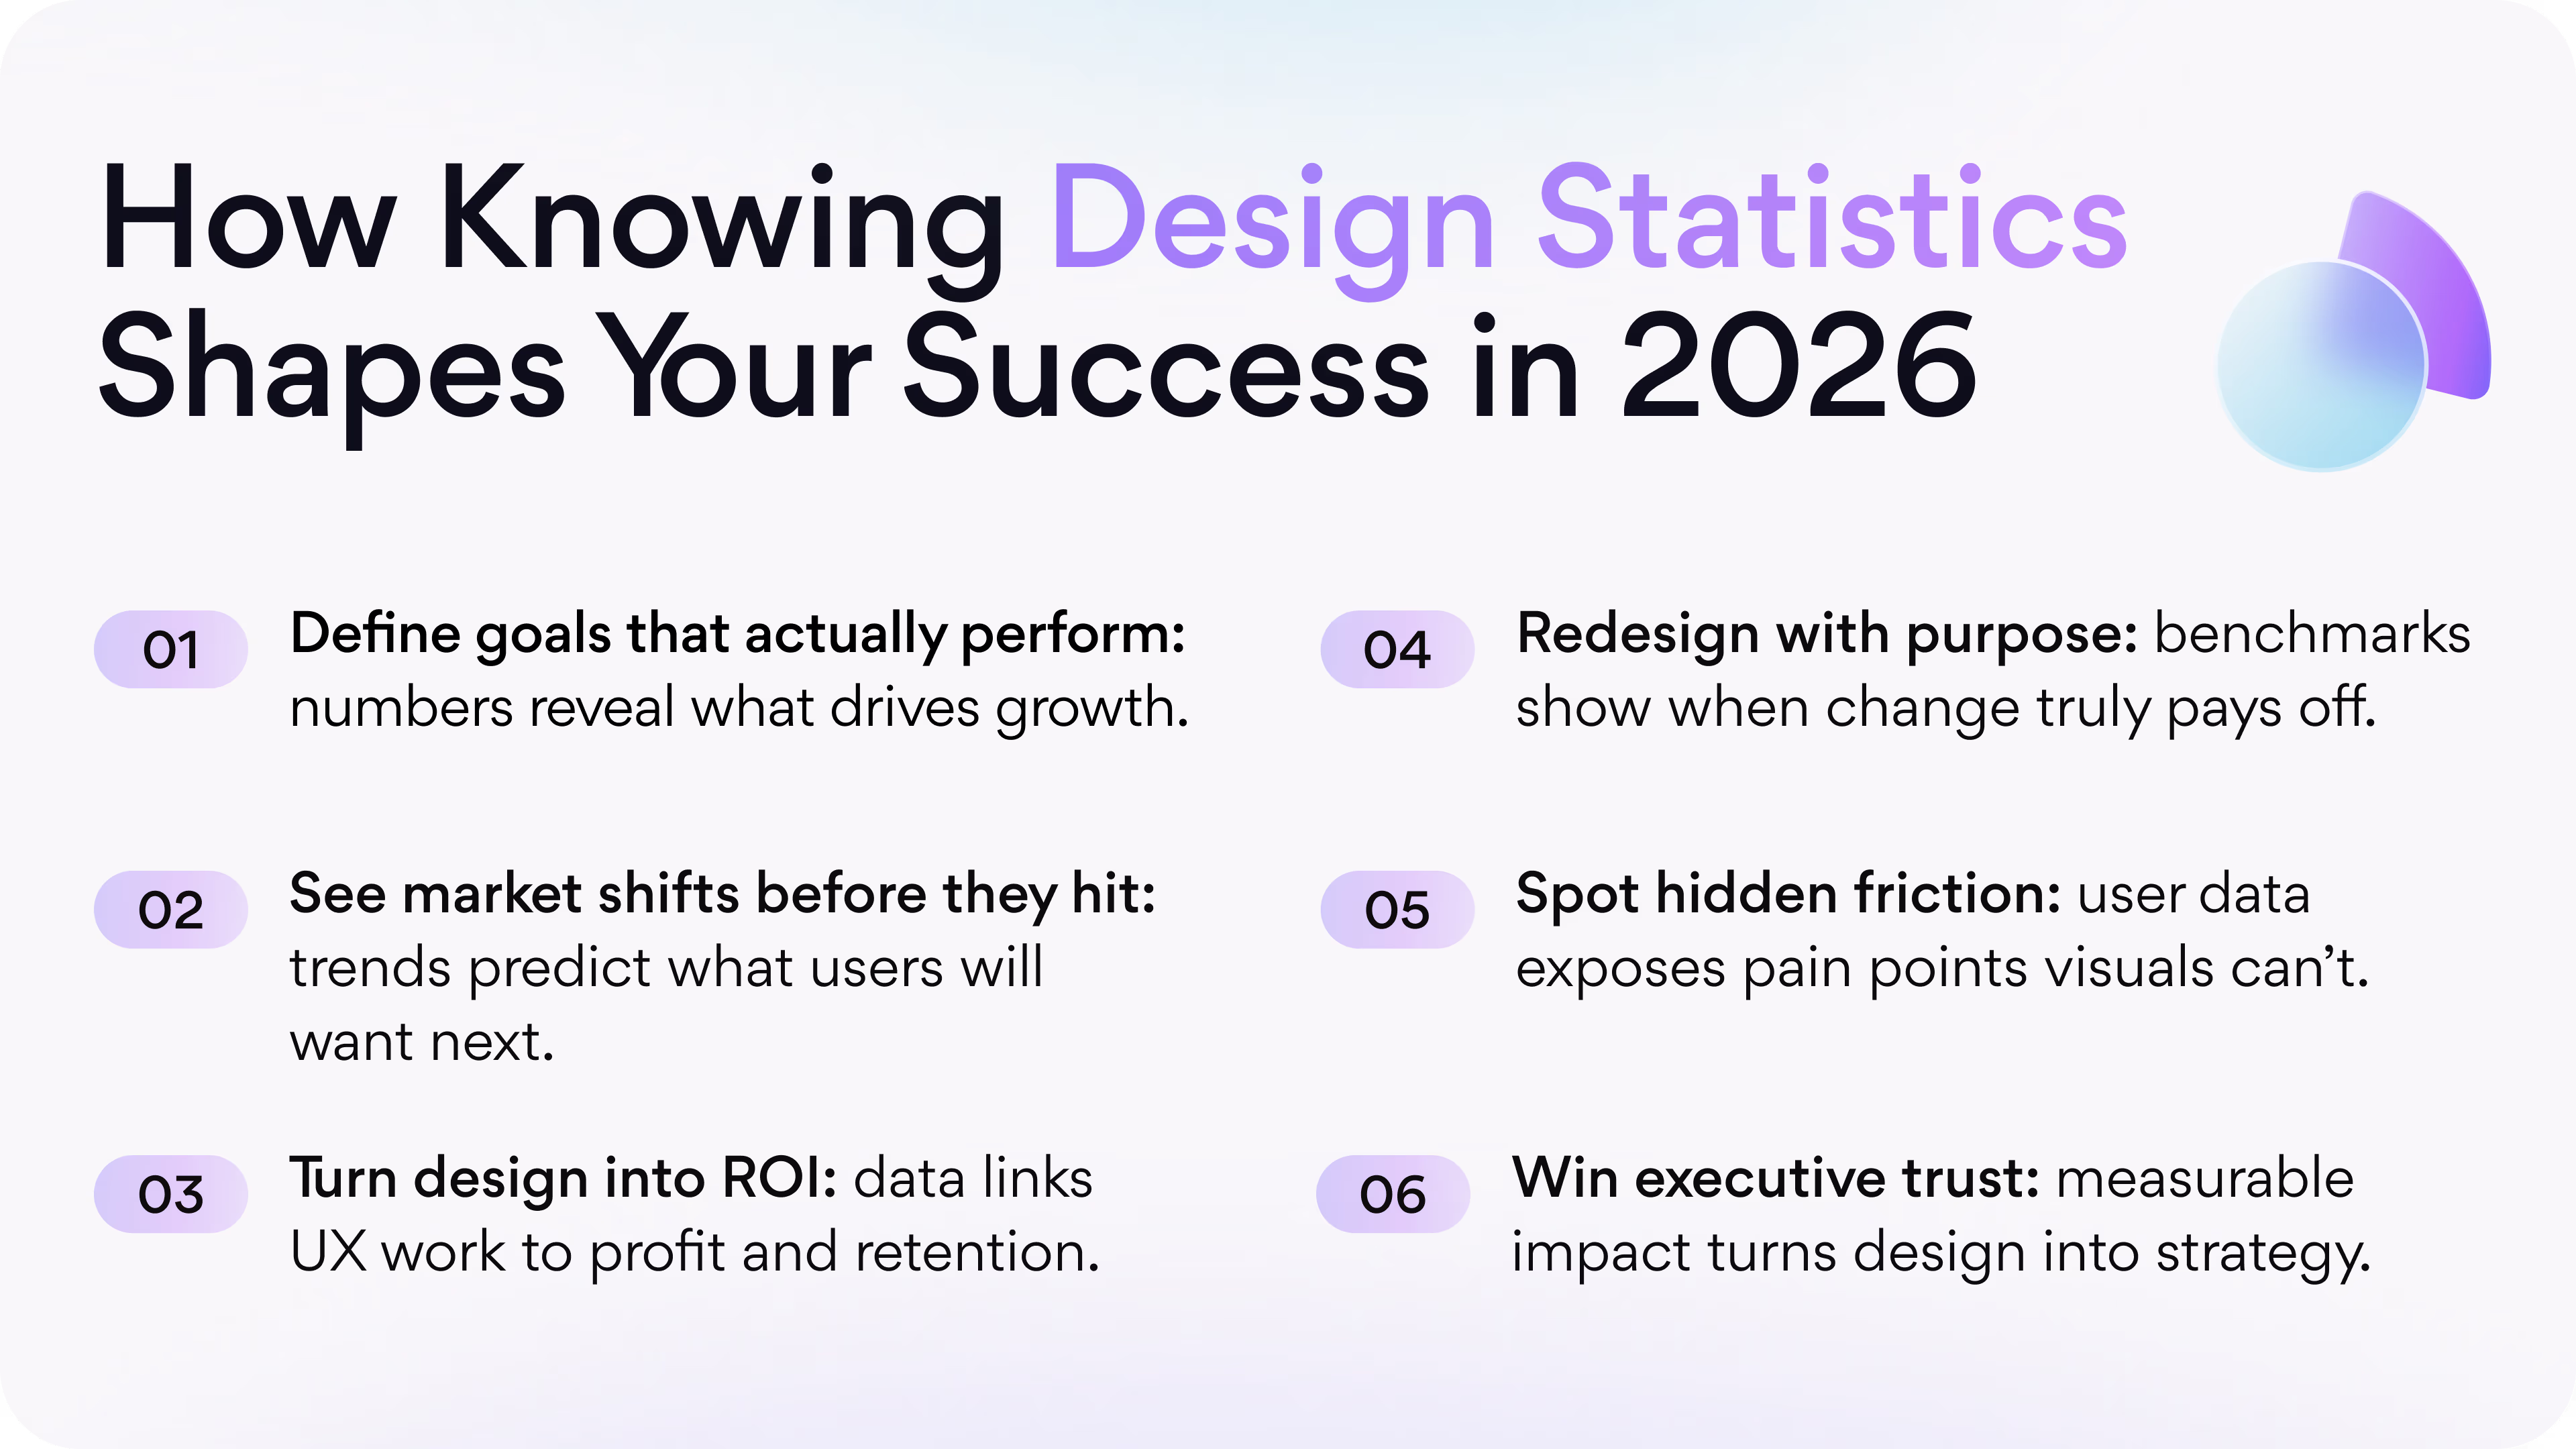
45+ UX Statistics Nobody is Talking About: Real 2026 Data

User behavior never moves in a straight line. What feels normal today can be a deterrent for users tomorrow, and the smallest friction point can cost conversions over time. The rules of engagement change with each new platform, feature, and algorithm update. The only way to keep up with this is to measure what is actually changing.
If you want a site, platform, or product to generate more conversions, better engagement, and less churn, you must understand how consumers engage with them and how that consumer behavior changes each year in different industries. The only way to see patterns before there are problems is through data.
That’s why our Arounda team has put together 45 UX statistics for 2026. They tell you where the industry is headed and how design decisions will impact business growth. In addition to the numbers, we also give our insights and practical tips to help you prepare and make better design decisions in the year ahead.
Article Key Takeaways
Many teams still make design decisions based on outdated user experience stats. In this article, we’ve rounded up 45 current user experience data statistics on user behavior, attitudes, and conversion trends for 2026. You’ll see which design improvements actually drive ROI, ways to reduce churn, and how to use real data to inform smarter redesigns and product growth strategies.
Eye-Opening UX Statistics That Are Worth Your Attention
Below are the most eye-opening design statistics of 2025 that reveal how design choices influence ROI, retention, and user satisfaction.
UX ROI & Revenue Impact
- Up to 10.8 % higher revenue retention over three years: Forrester’s Total Economic Impact™ studies (2025) show organizations adopting user testing for digital experiences achieve revenue retention improvements of up to 10.8% over three years, primarily via enhanced customer satisfaction and digital product improvements. For example, after implementing continuous UX research via UserTesting, a composite organization modeled by Forrester saw retention rate increases of 3.6% in year one, 7.2% in year two, and 10.8% in year three, even after risk adjustment.
Forrester - 50% of organizations realized 20% cost savings through digital transformation: Deloitte’s 2025 business services survey found that 50% of organizations realized over 20% cost savings by focusing on digital and experience-driven transformation, with additional value generated through better customer and employee experiences.
Deloitte - 351% ROI from UX and design optimization: Forrester’s impact modeling for UX design/dev tools, such as Figma Dev Mode, estimates a 351% ROI over three years due to accelerated workflows, reduced defects, and improved collaboration.
Forrester - $10.4 billion in added value from design-driven GenAI experiences: A McKinsey study finds that GenAI and design-driven digital experiences in retail produce key customer experience improvements (such as halving checkout time and user effort), directly driving higher conversion, adoption, basket size, and unlocking up to $10.4 billion in potential value in specific markets.
McKinsey - 1.7× faster revenue growth and 3.6× higher shareholder return: BCG’s 2025 research finds that firms leading in AI and design outperform laggards by 1.7x in revenue growth and 3.6x in total shareholder return over three years. Their analysis links strong design and digital practices to substantially higher business value across multiple metrics.
BCG - +31% average conversion growth after UX redesign: Based on our clients’ results across SaaS, FinTech, and Web3, Arounda’s redesigns drove an average +31% increase in conversion rates and up to +50% improvement in user engagement.
Arounda Agency - Design maturity drives higher growth and loyalty: Deloitte further confirms that better digital and design capabilities translate directly to faster revenue acceleration, higher customer loyalty, and greater cost-to-serve efficiency.
Deloitte
Our Arounda Insights:
The 2025 data on redesign ROI statistics show that UX now derives real growth with efficiency in mind. It defines the rate at which a user gets to discover the product’s value and become a part of it. Leading companies today already use design to reduce churn, increase satisfaction, and help individuals make decisions easier. In 2026, the result will shift to data-led design, perpetual learning, and greater utilization of AI so that users’ experience can be simplified and extremely rewarding.
Recommendations from our design team for 2026:
- Treat UX research as an investment engine: adopt continuous testing loops that validate user behavior and feed insights directly into product roadmaps. Set quarterly retention or NPS targets for every initiative.
- Leverage AI in design ops: AI-enabled prototyping and analytics may limit the design-to-deployment timeline and defects during handoff. This will free up budget for experimentation and measurable user impact.
- Prioritize speed to value: map the steps from first interaction to user payoff and remove unnecessary friction. The faster users reach value, the faster revenue compounds.
We spoke with our expert UI/UX designer about the trends shaping UX ROI and business impact in 2026. Here’s how she sees the industry evolving:
“AI is changing how we work in UX – from research to early prototypes. It helps us test and create ideas faster, but the most important part still comes from people: understanding context and emotions. Voice, gestures, and simple, accessible experiences will keep shaping how users connect with products.”
Oleksandra Ahapova, UI/UX designer
The Cost of Poor UX
- Up to 30 % annual increase in cloud and IT costs: Inefficient digital processes make cloud and infrastructure systems consume more resources each year. This growth in operational spending makes it harder for companies to track ROI on new digital projects, including generative AI.
IBM - 38 % of IT specialists cite tech complexity as a barrier: When systems are difficult to use and integrate, everyday work slows down. Deloitte reports that this kind of digital friction causes billions in lost productivity across organizations.
Deloitte - Poor UX directly triggers customer abandonment: Forrester found that confusing or poorly designed digital experiences push users to leave transactions unfinished, hurting both online commerce performance and overall company revenue.
Forrester - 32 % of customers quit after one bad experience, 59 % after several: PwC’s research shows how quickly user trust erodes when digital interactions fail, highlighting how poor UX directly damages retention and brand loyalty.
PWC
Our Arounda Insights:
Recent research makes it clear that poor UX drains business health from within. When processes get tangled, cloud costs rise, teams slow down, and customers walk away. What looks like a small usability flaw quickly turns into lost time, money, and trust.
Fixing UX changes the story. Organizations that decide to create simplicity within their systems will experience more fluid operations, faster adoption, and less turnover. A strong experience enables users to act with less friction and enables technology to serve people - not the other way around.
Recommendations from our design team for 2026:
- Simplifying every path: reduce cognitive load, unify flows, and make core actions feel effortless.
- Prioritizing speed and responsiveness: keep every interaction light and immediate to maintain momentum.
- Designing for trust: show progress obviously, explain what each step means, and be honest about what users can expect from the first click.
- Connect teams and data: Help designers, developers, and analysts to work together as one process so that products are easier to use and cheaper to maintain.
Redesign Timing & Triggers
- Generative AI speeds up redesign cycles: Many teams incorporated AI systems in 2025 to speed up redesigns.
Forbes - Leaders redesign every 6 months or less: The large players redesign their websites about two times a year. Regular small redesigns keep them agile and compatible with what users expect.
Adobe - AI makes content teams faster by 30-40%: Businesses that use AI-based tools for content and design production report much quicker delivery times and smoother creative workflows.
BCG - Mobile-first redesigns lift engagement by 74%: Reports say that when companies redesigned their webpages around mobile usage, the engagement increased by 74%. People hang around longer when pages load quickly and are mobile-friendly.
HubSpot
Our Arounda Insights:
These user experience statistics reveal a fundamental shift in how companies define their goals for website redesign. AI integration transforms the economics of iteration, lowering experimentation costs and reshaping how success is measured. Modern teams now view redesign to cost as a strategic decision, balancing efficiency with measurable retention impact.
Performance and mobile experience data add another layer: every delay in UX improvement carries a measurable retention cost, and companies that postpone responsive optimization lose recurring users long before churn even appears in analytics.
Recommendations from our design team for 2026:
- Quantify design latency: how long does it take to recognize a UX problem and be able to ship improvements? The less the latency, the more stable the retention and conversion.
- Use AI smartly in your design flow: use AI tools for prototyping, testing, and analytics to allow projects to speed up, but keep people in charge of the decision-making.
- Connect redesigns with real goals: each redesign must affect the improvement of important metrics such as bounce rates, decreased checkout latency, or decreased support issues. If it isn’t borne out by the data, it’s not a meaningful redesign.
- Run micro-redesigns monthly and full refreshes annually: think of UX as a measurable ongoing business process with known KPIs rather than a one-off creative push.
Key Performance Metrics
- +28% conversion and +15% retention from better mobile UX: When brands improved how their sites worked on mobile, shoppers had smoother experiences. That change alone brought a 28% jump in conversions and 15% more returning users.
Google - Updated design provides positive results in repeat purchases: E-commerce platforms that refreshed their interfaces in 2024 noticed more loyal buyers. Repeat purchases went up by around 18%, while cart abandonment dropped by a quarter.
Statista - Checkout optimization delivers measurable ROI: Online stores that made checkout faster and pages lighter saw about 25% higher conversion rates and 10% better customer lifetime value.
Google - 85% user satisfaction and 70% retention average across projects: Consistent UX optimization and performance-based design increased user satisfaction to 85%+ and user retention by over 70%.
Arounda Agency - UX investment strengthens satisfaction and retention: Increased investment in UX research and design correlates with 20–30% improvements in customer satisfaction scores and retention rates.
NN/g - 10-15% lower bounce rate through better flow design: Good UX design can reduce bounce rates by 10–15%, primarily by securing the “second click” after initial engagement.
- 40% higher task success from clear hierarchy and navigation: Visual hierarchy and intuitive navigation increase time-on-task effectiveness by up to 40%, directly boosting overall engagement and satisfaction.
- 25% trust and loyalty growth through consistent experience: Experience consistency across touchpoints contributes to a 25% increase in user trust and repeat visits.
NN/g
Our Arounda Insights:
UX results today expose how design decisions shape the real economy of a product. Mobile experience has become the front door to revenue: when navigation feels effortless and checkout takes seconds, users return and spend more. Each improvement in clarity and speed compounds trust and directly raises conversion rates.
By 2026, firms that will still refuse to have measurable frameworks for UX will find themselves paying dearly for that neglect in customer churn, lower repeat rates, and higher acquisition costs. It simply is too costly to rely on intuition instead of behavioural data. If one is incapable of measuring the retention curve or latency in conversion, one is already falling behind competitors who know this stuff inside and out.
Recommendations from our design team for 2026:
- Run structured UX audits each quarter. Identify where users hesitate, drop off, or experience decision fatigue. Each second of delay or confusion has a measurable monetary value.
- Prioritize mobile as the default experience. Most transactions and interactions start on mobile; improving responsiveness, clarity, and checkout flow directly drives growth.
- Redesign checkout and payment logic. If your conversion requires more than three steps, you are losing customers with every click.
- Turn UI performance metrics into executive KPIs. Treat retention rate, CLV, and bounce rate as business goals, not as design outcomes.
- Adopt continuous testing loops. Integrate behavioral analytics and rapid iteration to detect experience decay before it impacts revenue.
Industry Benchmarks
- +1.8× more retention from heavy UX investment: Companies that invest more than 10% of their digital transformation budget in UX design enjoy a 1.8× greater customer retention, proving a quantifiable correlation between UX investment and customer loyalty.
Accenture - Up to +20 NPS points from UX redesigns: Businesses that concentrate their efforts on user experience-related improvements see increases in NPS of up to 20 points, showing increasing customer satisfaction and advocacy.
KPMG - 30% higher CSAT in digitally mature companies: Companies that are at the peak of the digital experience maturity scale have customer satisfaction up to 30% greater than less mature competitors, while customer retention has increased by 20%.
Harvard Business Review - +24% conversion from faster loading: Websites that load quickly, especially those that achieve LCP of under 2.5 seconds, experience conversion increases of 24% and 32% fewer bounces, indicating the positive ROI in performance optimization.
Google - +7% engagement from 100 ms faster input: A 100 ms improvement in FID resulted in a 7% increase in user engagement and further demonstrates that even slight enhancements in speed will affect engagement depth.
Accenture
Our Arounda Insights:
In 2026, performance budgets will be mandatory, with LCP under 2.5 seconds and INP under 200 milliseconds on mobile. UX investment will settle between ten and twelve percent of digital transformation spending. Guest-first checkouts and wallet payments will define frictionless experiences, delivering double-digit conversion and NPS gains. Product teams will measure success through monthly UX improvements, not periodic redesigns.
Recommendations from our design team for 2026:
- Set measurable UX targets: before you begin the redesign, it is important to define measurable goals in terms of retention, conversion, and loading speed that must be reached
- Simplify the decision-making paths: reduce the number of steps at checkout, reduce the number of fields in forms, and introduce clearer calls to action in order to reduce doubts and drop out from browsing.
- Integrate performance in design systems: speed, response times, and stability should be part of the design elements rather than merely an afterthought.
- Invest where users feel the lag: focus budgets on mobile and high-traffic pages where milliseconds decide engagement and long-term loyalty.
UX Industry Growth
- $742.58 billion global software market by 2025: The global software sector, which includes Digital Design and User Experience tools, will be worth $742.58 billion by 2025. This reflects the massive investment amount that is being spent on digital product ecosystems.
Statista - AI-driven UX tool adoption growing ~38% CAGR: The adoption of AI-enabled UX tools is expected to grow at a CAGR of about 38% until 2030. As more companies seek faster and more personalized experiences, revenues are expected to increase.
Forbes - UX/UI roles are among the fastest growing digital professions (45% CAGR): UI/UX designers' world market is likely to increase by 45% p.a. from 2025 - 2030, which means that UX is among the fastest growing jobs in the digital economy.
WE Forum - 1.5 million UX talent gap projected for 2025: Global shortages of skillful UX personnel are projected at about 1.5 million positions, with the largest effect in Asia-Pacific and North America.
KPMG - 85% of firms expanding UX and AI budgets: In 2025, 85% of companies increased spending on AI and digital experience programs, and 91% are looking to expand in 2026, making it clear that UX-led transformation is going to be strong.
Deloitte
Our Arounda Insights:
The UX design industry growth rate statistics show that the market is shifting from expansion to acceleration. Growth in software investment and AI means velocity, not volume, defines success. With design talent stretched thin and automation surging, the real advantage moves to teams that can transform data and AI feedback loops into tangible design improvements.
Recommendations from our design team for 2026:
- Build a hybrid workflow: pair human UX research with AI data analytics, which decreases the time spent on discovery and iteration.
- Expand UX operations inside the product cycle: embed designers in development sprints to keep experience aligned with performance.
- Plan budgets around measurable output: tie funding to conversion lift, retention, or satisfaction rather than project size.
User Behavior Patterns
- Fewer than 4 clicks to conversion improve flow: Click depth to conversion in top e-commerce markets is optimized to fewer than four clicks on average, minimizing navigation drop-off and helping users complete purchases faster.
Statista - 8.25-second attention span defines first impressions: The average human attention span has declined to 8.25 seconds in 2025, with users spending only 1.7 seconds deciding whether to engage or scroll past – making early clarity and visual hierarchy essential.
SQ Magazine - Trust perception up by 41%: Clear brand systems and recognizable interfaces improved perceived trust and credibility metrics by an average of +41%.
Arounda Agency - AI-personalized microcopy drives engagement: AI-enhanced microcopy generation in 2025 adapts dynamically to user behavior, tailoring callouts and instructions, which significantly improves clarity and interaction quality.
Pippit - 62.54% of web traffic is mobile, but desktop users engage deeper: Mobile devices were responsible for 62.54% of global web traffic in Q2 2025, but desktop users spent more time per session and more time on pages due to their superior engagement depth.
Statista - 71% of users link trust to transparency: 71% of consumers in 2025 rate brand transparency as a top factor in building trust and loyalty, showing how openness directly impacts long-term engagement.
Global Horizon News - Emotional AI boosts user trust and comfort: IBM’s 2025 research finds users increasingly expect AI systems to recognize and respond to human emotions, shaping satisfaction and perceived reliability in digital experiences.
IBM
Our Arounda Insights:
Users now operate on instinct. The 8.25-second attention span leaves no room for confusion, meaning UX decisions must be made for immediate comprehension. Four clicks to conversion define the new efficiency threshold – anything longer feels like friction. Emotional intelligence in AI alters expectations: people want all systems to feel fast and human.
Recommendations from our design team for 2026:
- Focus on micro-simplicity: strip unnecessary journeys of their secondary actions, allowing them to be done in four steps or less.
- Design for 2-second comprehension: design every screen so that the user can tell what to do in two seconds through hierarchy, visual cues, and action-first design.
- Integrate adaptive microcopy: use AI-driven language systems that can modify tone, length, and clarity based on context and user intent.
- Treat transparency as UX, not PR: bring pricing, data, and personalization details into the experience to create trust rather than relying on disclosure pages.
Speed & Performance
- Core Web Vitals define “good” speed standards: "Good" performance thresholds: LCP ≤ 2.5s, INP ≤ 200ms, CLS ≤ 0.1 (all at 75th percentile of users).
Web.dev - Slow digital systems cost up to 6% in revenue: Companies relying on slow (delayed) digital experiences report a 6% global revenue loss on average due to outdated or slow-processing systems, especially for customer-facing AI/UX.
IBM - Fast fintech apps cut churn by 14% and lift transactions by 10%: Fast-loading fintech applications reduce customer churn rates by 14% and increase transaction volume by 10%.
PWC - AI-driven speed boosts satisfaction by 15-20% and revenue by 5-8%: The AI-powered next best experience capability can enhance customer satisfaction by 15 to 20%, increase revenue by 5 to 8%, and reduce cost to serve by 20 to 30%.
McKinsey
Our Arounda Insights:
Even a one-second delay reshapes user perception of quality and efficiency. The gap between a two-second load and a five-second load is the difference between a completed purchase and a lost customer. As digital ecosystems grow heavier with AI layers, users still expect near-instant interaction.
In 2026, product success will depend not only on how quickly data moves, feedback appears, and systems respond. Companies ignoring speed metrics already lose measurable revenue, and the divide between fast and slow experiences will widen further.
Recommendations from our design team for 2026:
- Design for speed as an emotion: fast experiences feel modern and competent; include motion and feedback that signal immediacy.
- Reduce user decision latency: simplify flows in ways that limit visual and cognitive loads, so users can act in less than three seconds of landing.
- Balance the power of AI with response time: if AI functions introduce device delays, use predictive loading or staged interactions that mask delays.
- Audit real user speed: track 75th-percentile performance across real devices and networks to see how fast your product actually feels.
Real Redesign Results
- +38% onboarding completion and +52% mobile conversion: The redesign of Galaxy's brand identity and its website made the platform faster and easier to use. The increase in completion of the onboarding process grew by 38%, mobile conversion by 52%, and both time spent in session and feature engagement were enhanced. Clear visuals and a simple layout helped users find what they needed without confusion.
Galaxy - +85% user satisfaction and +70% retention: Following the redesign of MYSO Finance's branding and platform interface, the product achieved results of +85% user satisfaction, +70% retention, +15% new users, and +5% conversion growth. This was achieved through a more streamlined user flow, simplified navigation structure, and a more trustworthy visual system that helped users complete actions quickly.
MYSO Finance - 28 % lower onboarding drop-off and 35% higher user engagement: After designing MarketSpotter’s trading platform with a focus on clarity and mobile responsiveness, the team cut onboarding drop-off by 28% and raised mobile usage share by 50%. A cleaner interface, simplified charts, and touch-friendly layouts also led to a 35% increase in user engagement.
MarketSpotter - +85% user satisfaction and +87% retention: After working on Mine’d’s brand identity, mobile app UX/UI, and web platform, the team reduced onboarding friction and lifted mobile users by 25% while improving conversion by 8%. Cleaner workflows and separate experiences for Consumers and Experts drove these gains.
Mine’d - +15% customer satisfaction and +20% mobile user growth: After redesigning Xpence’s mobile app and web platform, focusing on onboarding, security, card management, and invoice upload features, the company saw customer satisfaction increase by 15%, mobile user growth by 20%, active card usage reach 78%, and user engagement jump by 1.5×.
Xpence
Our Arounda Insights:
In every product redesign case study above runs a basic pattern: where design clarifies decisions, removes friction, and builds trust, the UX design growth rate invariably follows. From finance to SaaS, products with aligned visuals, flow, and purpose around clear website redesign objectives achieve higher retention, engagement, and satisfaction. We know that success starts with the understanding of user intent and the translation of that intent into clear and confident design decisions.
Recommendations from our design team for 2026:
- Simplify critical paths: remove one step from every main flow to cut friction and lift conversion.
- Use real behavior data: analyze hesitation points and adjust layouts where users pause or scroll back.
- Prioritize emotional speed: make transitions and feedback instant to build a sense of confidence.
- Balance clarity and motion: use subtle animations to direct focus, not distract.
Expert Tips from Arounda Agency
After reviewing the latest UX data across industries, we see clear signals shaping 2026 design priorities. What is UX in statistics? It reflects how design choices translate into business results. Here’s what to focus on first:
- Speed first: Optimize loading, scrolling, and response times. Even minor delays cost conversions.
- Clarity wins: Make every action obvious. Don’t let users think twice about what happens next.
- Retention as a goal: Build flows that keep users returning — not just converting once.
- Mobile precision: Test on real devices, not mockups. UX must feel natural where users actually are.
- Iterate smartly: Refine design through real feedback loops, not annual redesigns.

Good design solves real business problems. It builds trust, drives growth, and turns every interaction into measurable value.
With more than nine years in digital product, web, and brand design, Arounda Agency helps companies shape experiences that move markets. Our UI/UX design services help you create products that look clear, work fast, and grow easily with your business.
Wrapping Up
The digital world keeps moving, and your design should move with it. To stay ahead, you need an understanding of the numbers, you need to see the stories that lie behind the numbers, and turn these insights into action. This is what our team can accomplish for brands, enabling design to act as a genuine growth mechanism – lifting ROI, building trust, and growing with your product. If you want your design to deliver results in 2026, contact us to create something that brings long-term success.


Table of contents


FAQ
According to UX stats, a company’s website redesign ROI is between 150% to 300% in 12 to 18 months after a redesign. That depends vitally on how much better the conversion routes of the new UX are, how much it decreases the dropoff rate of users, and how quickly it gets them to their goals.
Bad user experience costs businesses around 10–15% of their annual digital revenue. Confusing experiences, slow webpage load time, and unclear actions frustrate users, increase churn rates, and make acquiring new customers more expensive.
A redesign is warranted when a company finds its figures being static, its users leaving the site more quickly, or the technology being out of date. Many brands redesign once a year or so for the sake of making the sites reflect the brand and the audience.
The most crucial UX metrics are conversion rate, retention rate, time to perform, customer satisfaction, and net promoter score.
Most teams see tangible UX design ROI statistics within three to six months. That’s how long it takes for users to adapt, and for engagement to start increasing.
Even one more second of load time can decrease conversions by around 20%. The faster the pages load, the more users will trust your site and take the action you want them to take.


89+ Reviews
on Clutch

Top Rated Plus Agency
on Upwork

Top 50 Trending team
on Dribbble

Projects are Featured on Behance platform
